Skip table of contents

Reporting

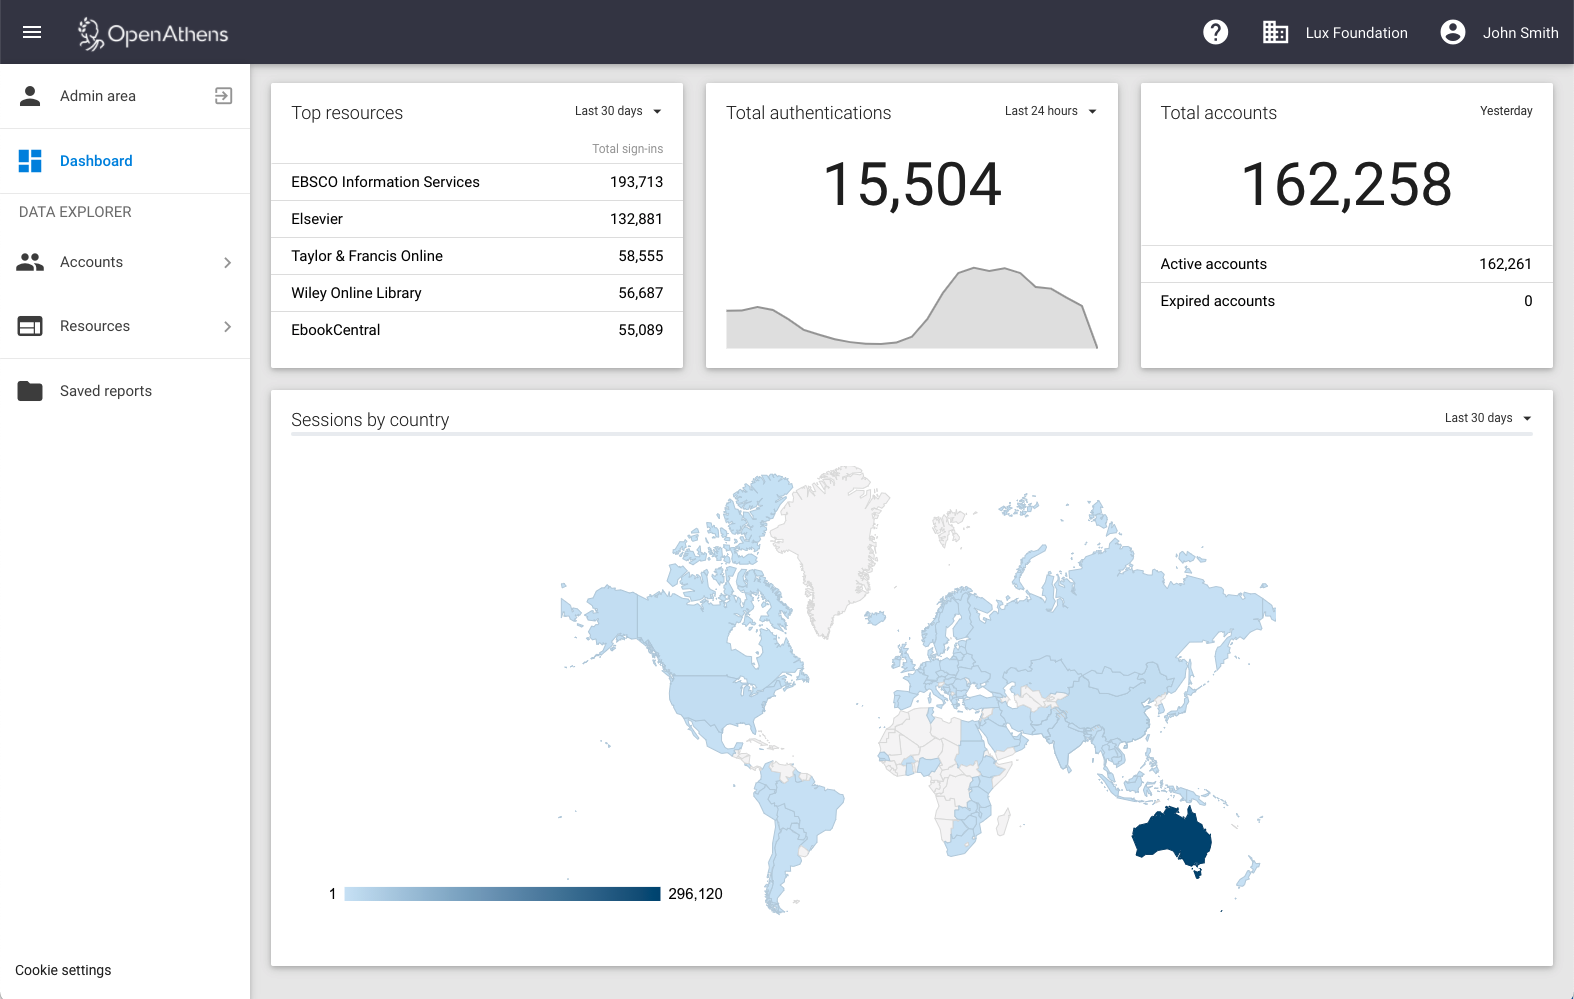
The reporting interface allows you to see how many of your users are accessing which resources and lets you break that down by several attributes. It can also show you how many accounts you had on a day, how that varied over time and information about authentications. The default breakdowns can be enhanced by setting additional attributes as reportable in your schema.


This section of the documentation is split into sections that cover viewing the reports and the options for saving or scheduling them. Start with the data explorer section.


FAQ

How do I access the reports?

There's a link in the administration area (top bar and in the statistics menu), or you can sign in directly at https://reports.openathens.net 

Is it possible to get older stats, say from more than four years ago?

Not directly, sorry. If you think you’ll ever need to go back further than four years you should regularly download the data you may need. 

How can I best take advantage of the options and features such as reporting by job role or similar?

See: How to make the most of the reporting options.

I just accessed something and it hasn't appeared?

The process that aggregates the data works in arrears - one hour for hourly aggregations and two for others.  

Are they in my timezone?

By necessity we have to record and process them in the UTC timezone. If you are near the dateline then this can make looking at individual days more challenging, but it balances out when you look at longer periods.

What's the difference between a transfer and an authentication?

An authentication is the act of signing in to OpenAthens. A user would typically only sign in once per session and then go on to access one or more resources. Authentications are covered by the account reports.

A transfer is where the resource transfers the user to us with a SAML request for data and us then transferring the user back to the resource or service with a SAML response containing your chosen attributes. This response is what we count a statistic for the resource based reports.

Transfers and authentications are not expected to match - transfers will generally be the higher number, but it is not impossible for authentications to be higher.

Why can I only see data for one organisation?

The report will initially default to showing you data for your own organisation as this will be what most people need, most of the time, but all reports have options to include sub-organisations via the scope control, and the interface will remember your last setting (uses a cookie). 

If you regularly need reports with different scopes, you can schedule them to be generated for you daily, weekly or monthly. 

Can I get API access to the data to create my own reports?

Yes. You can get aggregated resource access reports, and raw data - see: Fetching statistics reports via the API & Fetching raw statistics data via the API

Can I get per-user reports?

Not by default, but you can set any attribute (including username) as reportable via the schema editor. You should check out the page about reports and privacy before you do though as there can be legal implications around personally identifiable information (e.g. GDPR).

Can I download data about my accounts such as expiry dates or activation status?

Yes, but not in the reports interface. You need to go to the main admin area and list (or search) accounts. That page has a download option.

I have a question about GDPR...

These should be addressed to our data protection officer via the service desk.

Are OpenAthens reports COUNTER compliant?

This is covered by its own COUNTER stats FAQ, but the short answer is no.

Is it possible to see access broken down by each database / journal within a resource (e.g. Cengage, BMJ, etc)?

Unfortunately not. We only see the part where the user signs in so can only report on that - what the user does after they are authorised by the resource is only visible to the resource and the user.

Can I tell the difference between total accesses and how many individual accounts for a particular resource?

Yes. You can either show the resource as one of the series or download the data. 

Can I get reports particular sub-organisations without having to impersonate each?

For account usage you can do it in the interface by setting the scope of the data to ‘all organisations’ and then the breakdown to ‘organisation’. More reports may get this option in the future.

For resource usage, again select ‘all organisations’ as the scope but then use the save to my computer function. The downloaded data includes organisation names and ids.

What are unique users?

When you see a dotted line in the graph, or a column in a download saying unique, it means ‘distinct’ or ‘individual’ users, separate from the total - e.g. Bob counts as one unique user no matter how many times they sign in that day

Can I see where the accesses were from?

Yes. This is available on the Accounts > Usage report (successful authentications), and you can break down by country or network. Because these are ultimately based on IP address, they cannot be 100% accurate so should be considered informative rather than diagnostic. Location data is also included in raw reports available via the API.

Is there a way to export the graphic, and not just the data?

There isn't an export option but the scheduler function can send read-only views of the reports it generates to anyone you specify, and most operating systems have a facility for capturing part of the screen as an image - Windows has its snipping tool and Mac users can hit Shift+Command+4.

Can I zoom the map?

Sorry, no. To see all the data you need to leave the dashboard and select Accounts > Usage from the side menu. There you will have view and download options for the data.

Can I get usage broken down by resource with total usage for that month by things like job role, permission set, group i.e. a spreadsheet with rows of resources and columns of job roles (et al)?

Yes. Clicking on resources as the breakdown gives you a secondary breakdown option. Downloading the report will give you more choice in how it is displayed. 

Why do some reports seem to count the same thing more than once?

This happens when a user has a reportable property with multiple values - e.g. they might have both the staff and student role and each value will include that user’s stat when you break down a report by role. In most cases this is the desired behaviour but it does mean the column totals should be ignored on those breakdowns. Permission sets are the only default breakdown where you might run into this.

How long will the report data be kept? 

The raw data is kept for as little time as is necessary. The aggregated monthly data based on your sets, groups and your selected attributes will be kept for 4 years or until your domain is deleted, whichever is sooner.

What else can we break reports down by?

You can set almost any custom attribute you add to your schema as reportable and these will all be aggregated for reports. You can easily have things such as Job role, Cost centre, Department, Major etc.

Why don’t the numbers always add up?

Not all of the numbers are expected to - some examples:

  • if you add up unique users per day and compare it to unique users per month the daily total will be higher. This is because an active user will only appear once in the monthly total of unique users but could appear as often as once per day in the daily ones

  • if you add up transfers per permission set they can be higher than the total number of transfers because a transfer is recorded against each of the permission sets a user is assigned

See: How to make the most of the reporting options

Can I see turnaway data?

At the moment this is only visible in the raw report data available via the API and can only cover when restrictive mode prevents access. We can’t tell if the resource itself denies access after we have sent the user there.


JavaScript errors detected

Please note, these errors can depend on your browser setup.

If this problem persists, please contact our support.