Reports can be saved to our system (Create saved report), or downloaded in a couple of formats.
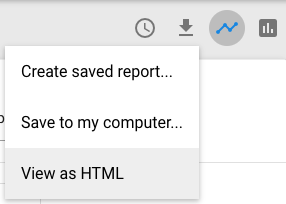
When you save to our system the reports appear under saved reports.
Downloading reports
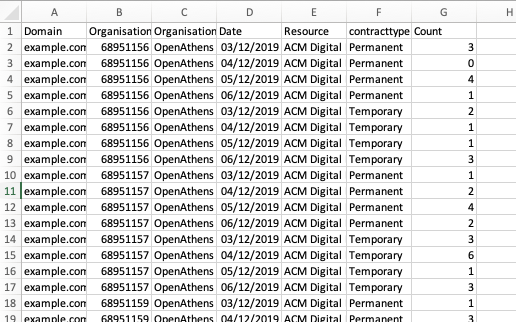
Reports can be very large, especially if you have a per-user or secondary breakdown. Because this can potentially produce reports that are wider than spreadsheet applications can handle, reports are downloaded in a 'flat' format rather than pivoted into a table to avoid problems.
Example:
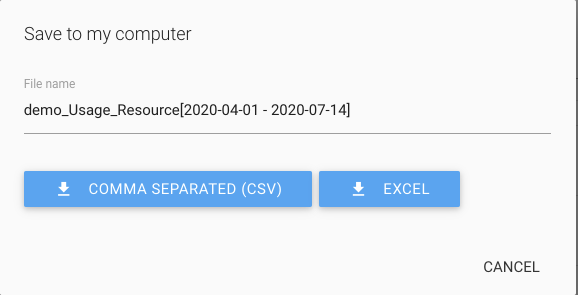
Both CSV and Excel options give you a plain text file with a .csv extension but the Excel version is tab delimited, which it finds easier to digest.
This format is well suited to use by tools such as Microsoft Power BI and Tableau, and can be easily unioned if you are, for example, downloading them on a schedule.
See also: Scheduling reports
Show the report as a table
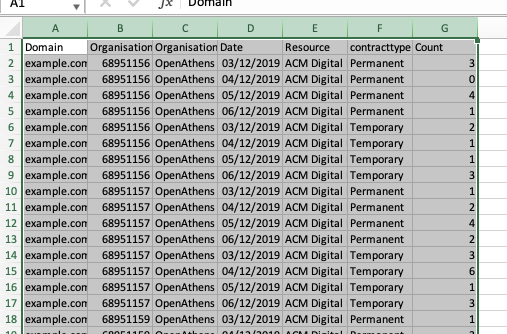
Whilst the flat format is great for computers, you may want to view the data as a table with two axes. Most spreadsheet software will do this in a similar way, but we'll use Excel as our example:
-
Highlight the columns with data
-
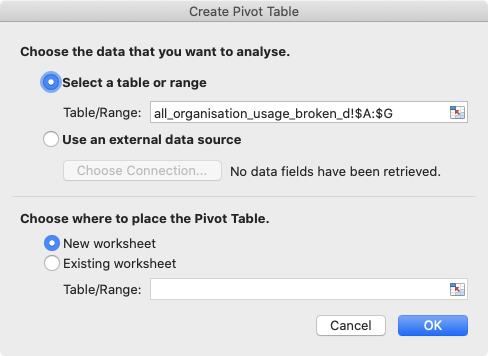
On the insert menu or ribbon select pivot table and click on ok in the dialogue box
-
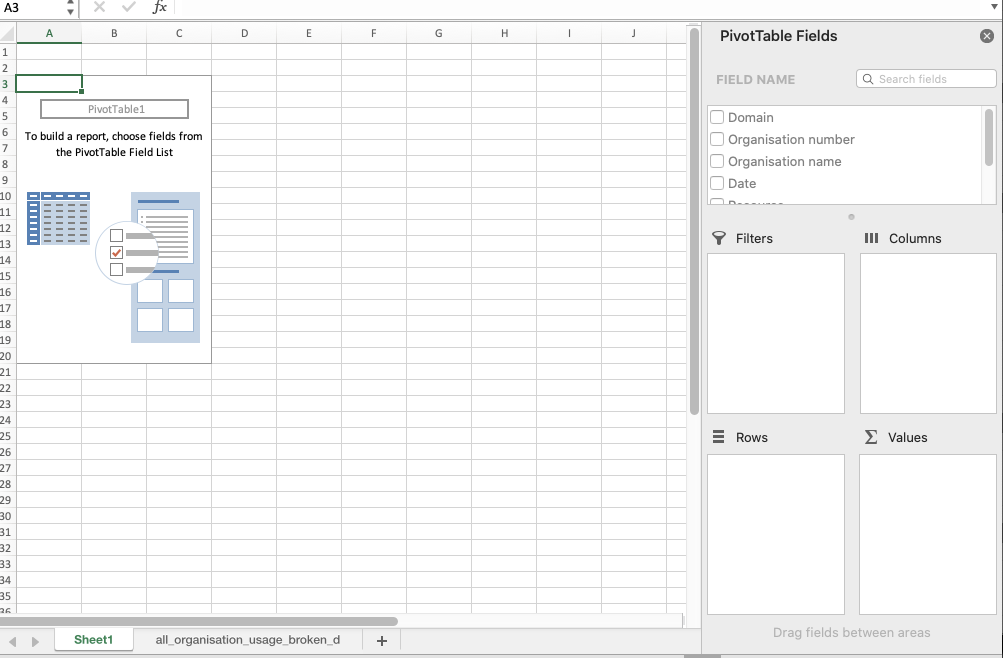
Click OK and you'll get something like this:
-
Drag your chosen dimensions from the fields box to the rows and columns boxes and drag Count to the values box
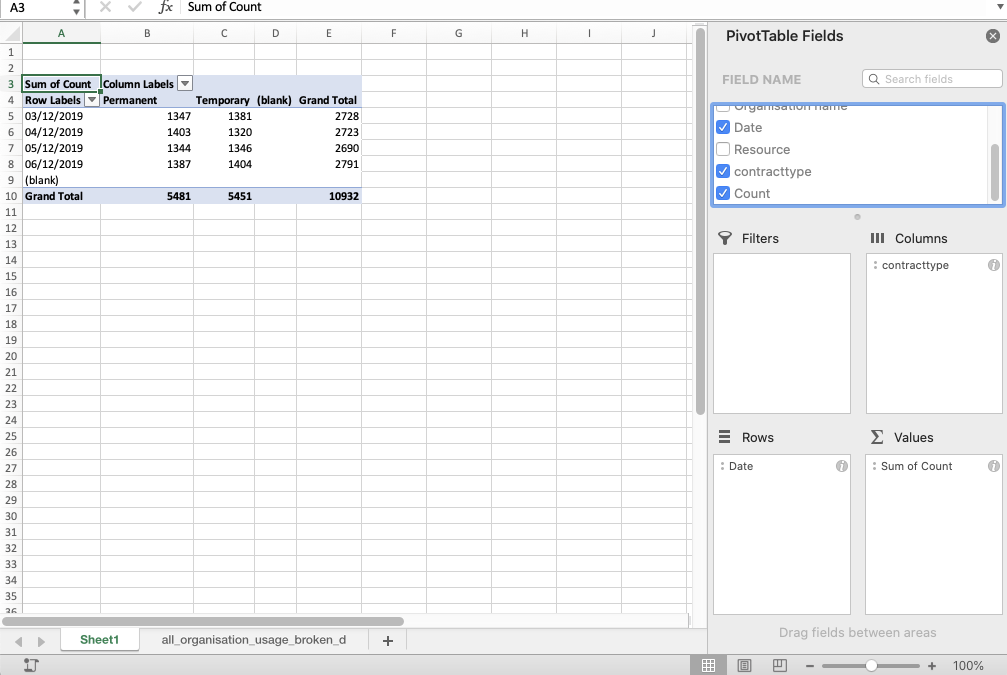
There's more you can do - have a play around with which fields are in rows and columns, and what happens if you put two in the same box. Pivot tables are a very useful tool to understand and there are many online tutorials that will help you master them.
Anything to watch out for?
Dates follow the ISO 8601 standard so will be expressed as yyyy-MM for monthly granularity, yyyy-MM-dd for daily, and yyyy-MM-ddTHH:mmZ for hourly. Examples:
-
2022-12
-
2022-12-25
-
2022-12-25T13:00Z
(The Z, for Zulu, indicates UTC as the time zone)