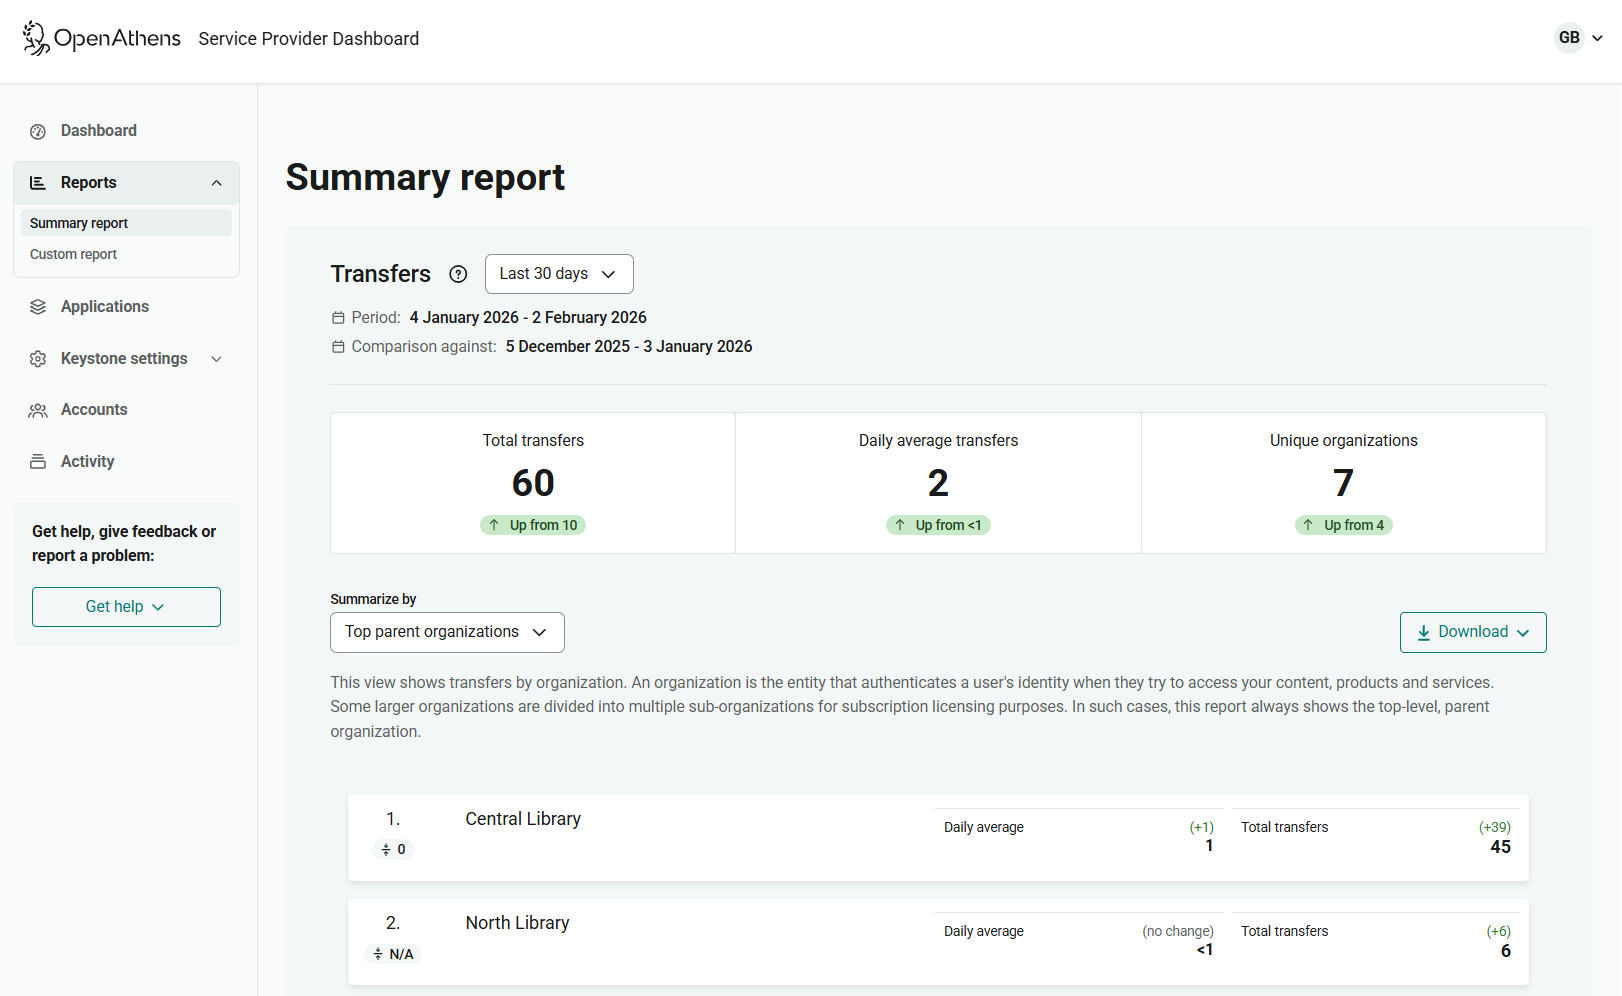
To view the summary report, go to Reports > Summary report in the main menu or click See full reports on the dashboard home page.
The summary report shows transfers for a choice of time periods, from the previous seven days up to the previous 12 months. 12 months is the default.
You can view the top organizations, countries and applications that generated transfers. Each statistic also has comparison data, showing if the number of transfers is higher or lower than in the previous equivalent period.
You can download the report as a file that includes more detailed information. If you open the file in a spreadsheet you can then manipulate the data further, for example by splitting out statistics for different sub-organizations (if relevant).
Set date range
From the drop-down list at the top of the page, select the date range to view.
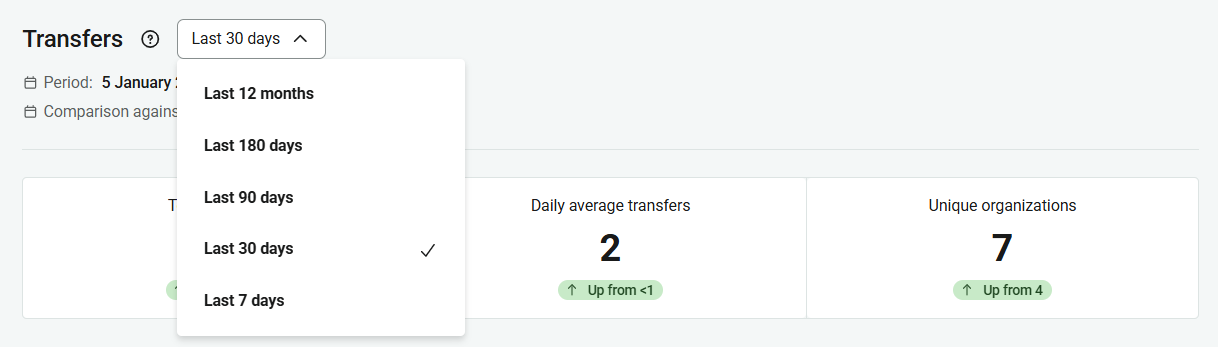
Depending on the volume of traffic in your statistics, selecting a longer date range might cause the report to load slowly. Some reports may be too large to display in the browser, although you can still download them as a file.
Compare data from previous period
Alongside your total number of transfers and the numbers for individual organizations, applications or countries, another number shows the change from the previous reporting period. For example, “+6” shows that six more transfers took place in the currently selected date range than in the previous one. “7, up from 4” shows that seven transfers took place in the current date range, an increase from four in the previous one. The comparison is highlighted in green if it’s an increase, in red if it’s a decrease.
The date range used for comparison is the last one of equivalent length. For example, if you view a report for the last 30 days, the comparison period will be the 30 days before that.
Break down the data
You can break down the transfer statistics in several ways. By default, the summary report shows statistics by Top parent organization. This view lists the top-level organizations or institutions from which most of your traffic comes.
To see a different breakdown, select it from the Summarize by drop-down list.
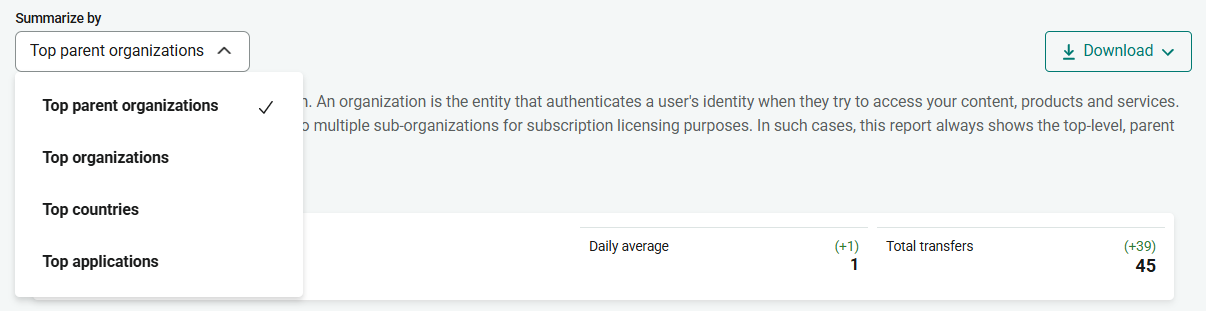
The options are:
-
Top parent organizations. The default. Shows the number of transfers from each top-level organization, with the organization that generated the most transfers listed first.
-
Top organizations. Similar to Top parent organizations, but if a customer organization is divided into multiple sub-organizations, each sub-organization is shown separately. (If none of your customers have sub-organizations, this data view is effectively the same as Top parent organizations.)
-
Top countries. Shows the number of transfers from each country in which your customers are based or registered.
-
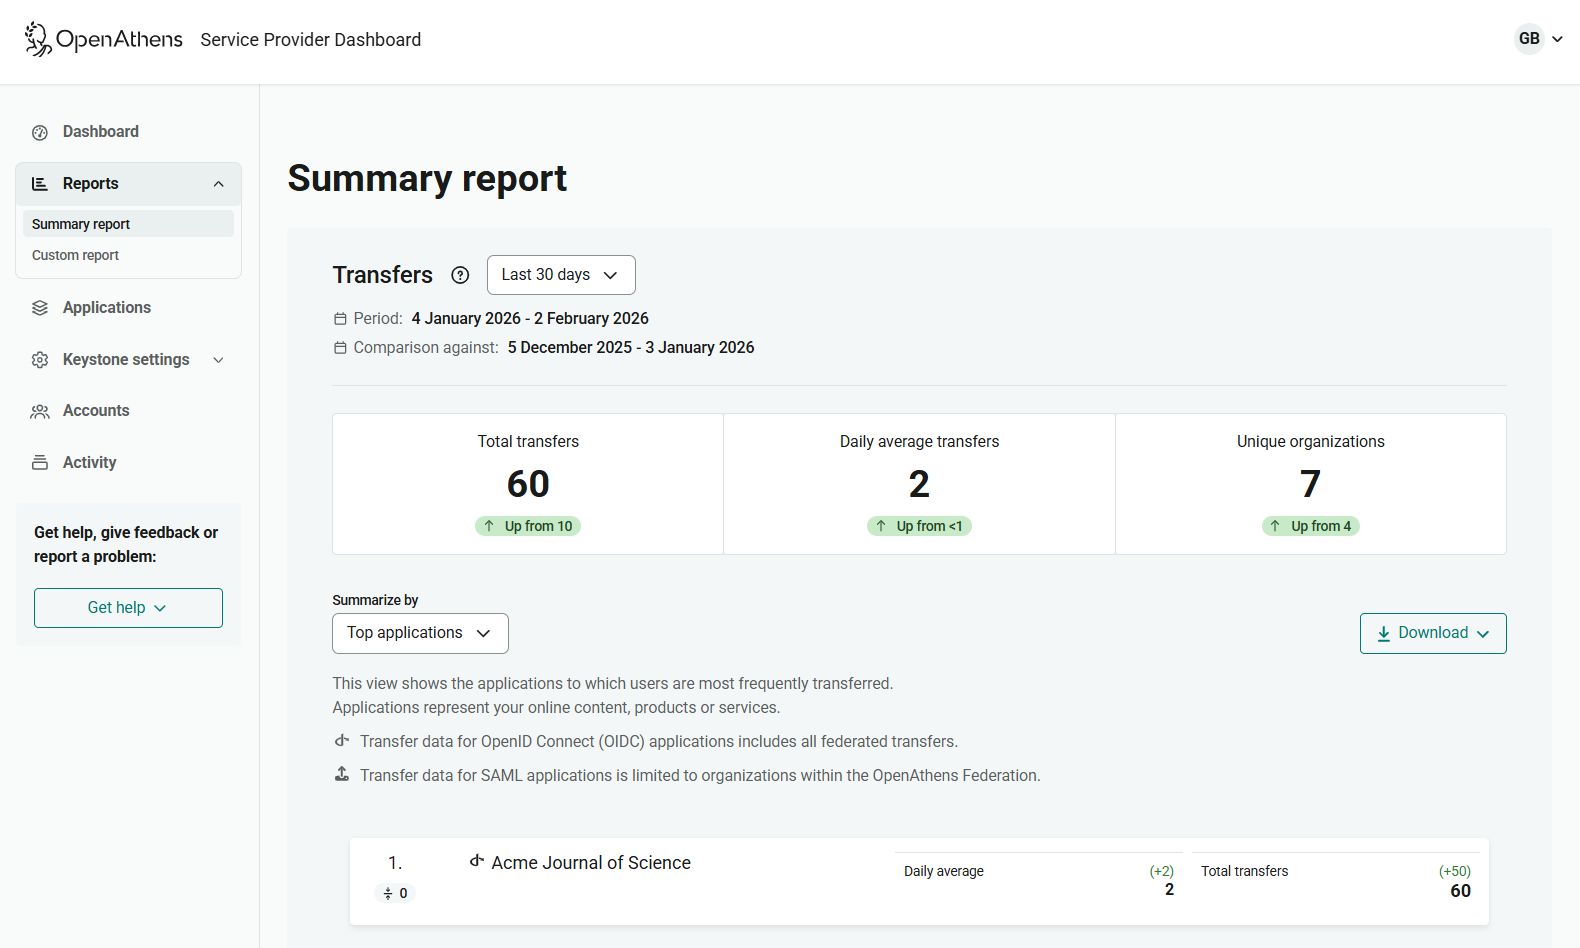
Top applications. If you have multiple applications, shows the number of transfers to each application. An application can be a specific journal, database, etc.
Download the report
To download your report, press the Download button. The download is a flat CSV file that you can load into a spreadsheet or other software.
For this report, you have the option to download Summary report or Full report. The summary report shows aggregated numbers for each organization, application or country during the reporting period, and includes comparison data. The full report shows a more granular breakdown.
Columns in summary report
This report varies depending on the selected data view (Top parent organizations, Top organizations, Top countries or Top applications).
-
Start date. Start of the reporting period.
-
End date. End of the reporting period.
-
Comparison start date. Start date of the previous equivalent reporting period, against which this report’s statistics are compared.
-
Comparison end date. End date of the comparison period.
-
Rank. Where an organization, application or country (depending on your chosen data view) ranks in total number of transfers during the current reporting period.
-
Comparison rank. Where the organization, application or country ranked in the comparison period.
-
Rank change. The difference between the current rank and the comparison rank.
-
Parent organization/Organization/Country/Application name. Depending on the data view you selected, the name of the top-level organization, sub-organization (if applicable), country or application against which transfers are logged.
If an organization is not divided into sub-organizations for subscription licensing purposes, “parent organization” and “organization” are effectively the same. -
Org country. (If you selected the Top parent organizations or Top organizations data view.) The country in which the organization is based or is registered as an identity provider.
-
Org entity ID. (If you selected the Top parent organizations or Top organizations data view.) The unique entity ID that identifies the organization.
-
Application type. (If you selected the Top applications data view.) Whether the application is an OpenID Connect application or a SAML application.
-
Application entity ID. (If you selected the Top applications data view.) Entity ID of the application.
-
Application ID. (If you selected the Top applications data view.) Client ID of the application.
-
Daily average transfers. The average number of transfers generated per day by the organization, application or country during the current reporting period. (Whole numbers only.)
-
Comparison daily average transfers. The average number of transfers per day during the comparison period.
-
Daily average transfers change. The difference between the daily average transfers in the current reporting period and the comparison period.
-
Total transfers. The number of transfers generated by the organization, application or country during the current reporting period.
-
Comparison total transfers. The number of transfers during the comparison period.
-
Total transfers change. The difference between the number of transfers in the current reporting period and in the comparison period.
Columns in full report
-
Parent organization. The top-level organization from which transfers came. For example, a university.
-
Organization. If relevant, a sub-organization beneath the parent organization, such as a specific department in a university. Sub-organizations are identified by scope. If a customer has no sub-organizations, the “organization” is effectively the same as the parent.
-
Org registration federation. The federation (or other means of authentication) to which the organization belongs.
-
Org country. The country in which the organization is based or is registered as an identity provider. Countries cannot be determined for 1:1 connections.
-
Org entity ID. The unique entity ID that identifies the organization.
-
Org scope. The scope (if any) that identifies a sub-organization.
-
Application name. The application to which the transfer was made.
-
Application type. Whether the application is an OpenID Connect application or a SAML application.
-
Application ID. Client ID of the application.
-
Application entity ID. Entity ID of the application.
-
Affiliation. Role of the user who made the transfer, such as Member or Student.
-
Transfer date: Date on which the activity took place.
-
Transfers: Number of transfers meeting the specified criteria.
If you are interested in using an API to download reporting data, let us know through the feedback form on this page or by writing to feedback@openathens.net.