Account reports
Account reports cover everything except resource access. Common elements are described on the data explorer page.
Any report you generate can be saved to your computer or scheduled, very useful if you have a lot of data that won't fit on the screen.
Totals
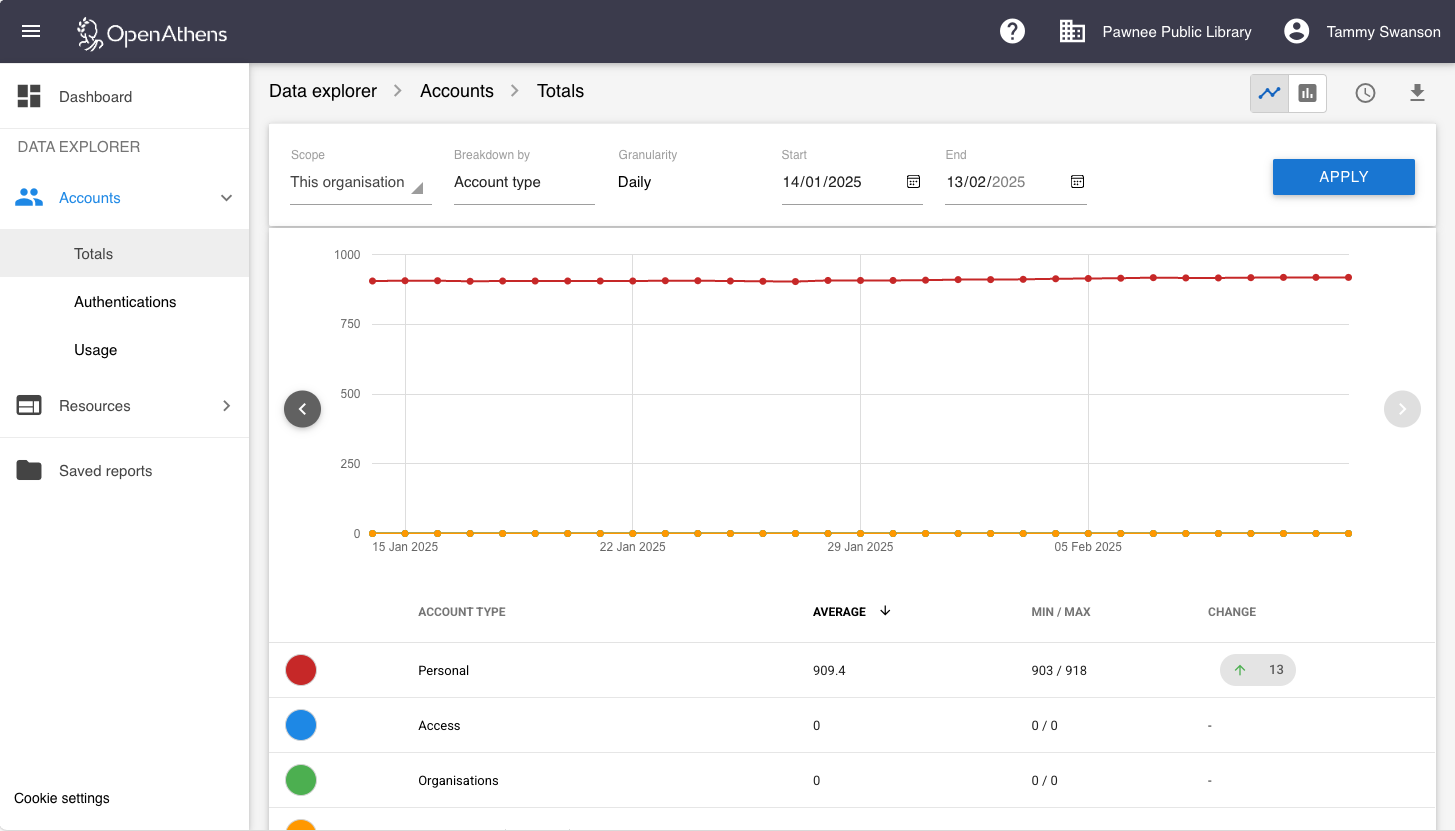
The account totals report is about how many accounts you have (and had) in various states
| Scope | This organisation All organisations |
| Granularity | Daily Monthly |
Breakdowns
By type - how many of which type of account did you have over the time period.
By status - how many accounts were in which state over the time period:
- active - activated accounts that can sign in (whether or not they did)
- expired
- pending - accounts not yet activated
- banned - accounts blocked by security monitoring
- disabled - local accounts blocked by manual setting
- suspended - local accounts blocked by rule
By activity - how many accounts did things such as get created, get deleted or various modifications over the time period.
By reportable attribute - any Boolean or choice attributes you have marked as reportable in your schema (with local accounts it's only choice attributes that are supported).

Authentications
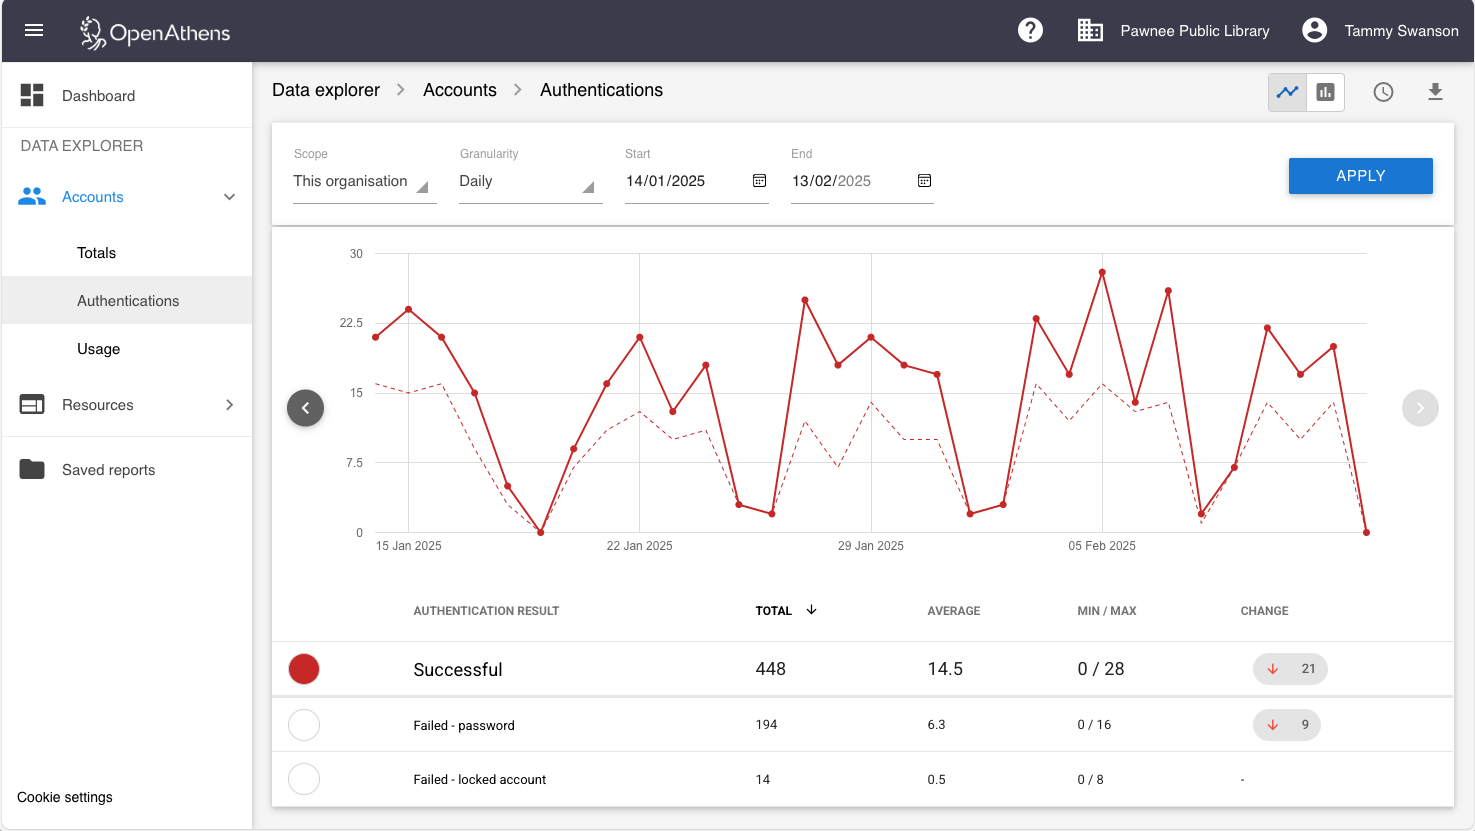
The authentications report is about accounts that fail authentication and why. Successful authentications are included for comparison.
| Scope | This organisation All organisations |
| Granularity | Hourly Daily Monthly |
Breakdowns
This report does not have any breakdowns because a failed authentication does not supply any data beyond the failure reason - the usage report (below) breaks down the successful authentications.
Unique
The dotted line on the graph represents the number of unique users - i.e. counting only one authentication per user in the granule. This shows you how many accounts were responsible for each of the totals in that granule - adding up unique users won't work as the same user could appear in several and you'll end up with a number bigger than your total number of accounts - use a larger granule instead. The number of unique users on any given day (e.g daily granularity) is also very unlikely to match the number of unique users at monthly granularity as those who sign in on Monday might not on Tuesday.
Unique also appears in the downloadable tables (without totals of-course).
The difference between locked, banned, and suspended
Locked is a temporary lockout when the wrong password is used too many times in a short period of time. Banned is when the system has detected what appears to be misuse and suspended is when you have set a rule on your local connector.

Usage
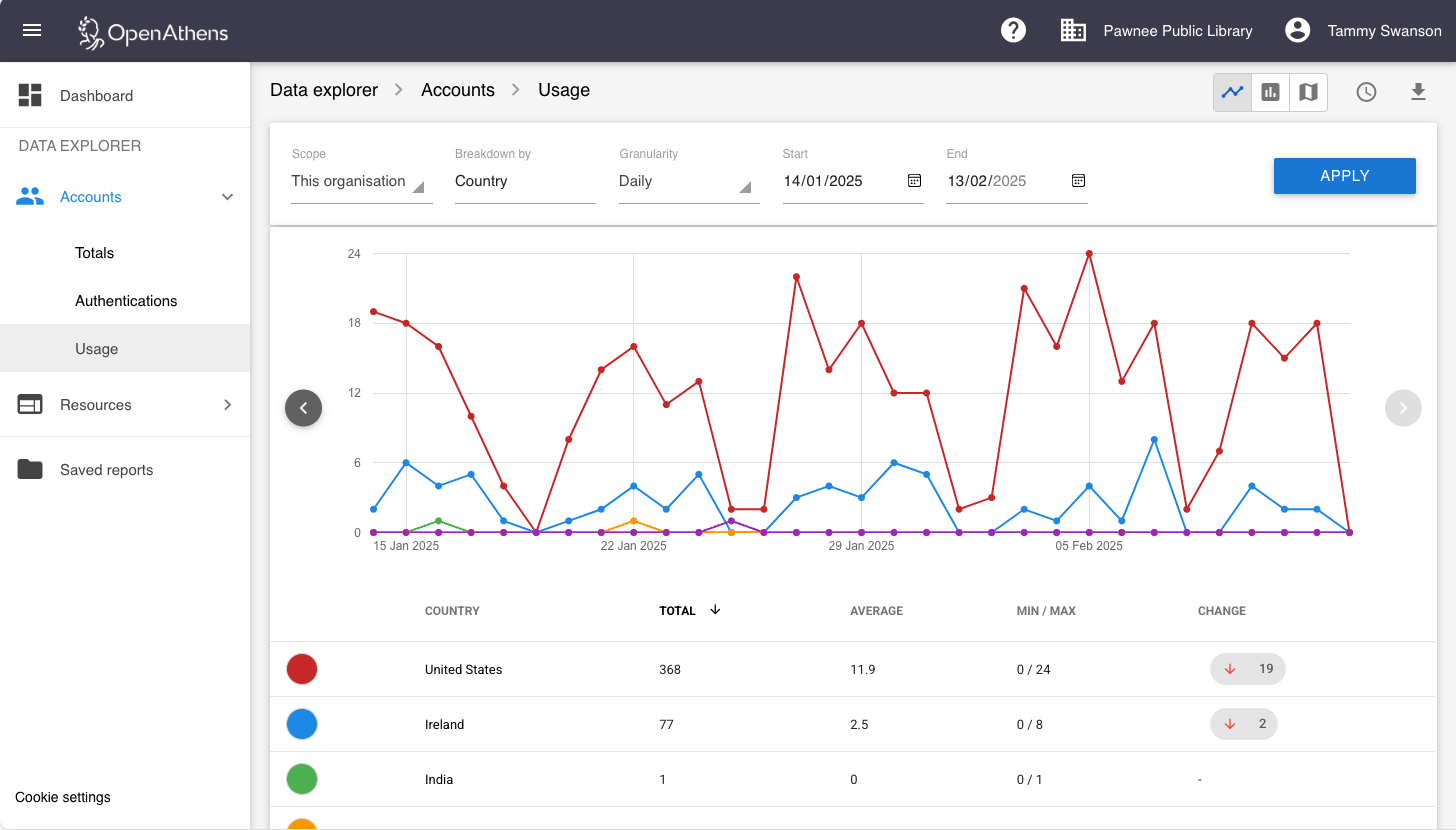
The account usage report is about the accounts that were successfully authenticated into OpenAthens.
| Scope | This organisation All organisations |
| Granularity | Hourly Daily Monthly |
Breakdowns
By country - the countries that the users were in when they authenticated (a map view is available).
By group - the user groups assigned to users who authenticated. Only available when the scope is set to 'this organisation'.
By network - the network domain the user was in, e.g. institiution.ac.uk, btcentralplus.com, comcast.net
By permission set - the permission sets assigned to users who authenticated. Only available when the scope is set to 'this organisation'.
By reportable attribute - any attributes you have marked as reportable in your schema.

Why aren't permission set and group breakdowns available over all organisations?
The simple reason is that both of them are specific to the sub-organisation rather than being global, and can be renamed, deleted or expanded by sub-administrators. For things you want to report on over all your organisations you should use a custom attribute - the 'choice' type is a popular way to restrict things to a set of possibilities that are defined by the domain administrator.
That said, the data is available in the downloadable versions. The easiest way to transition may be to add a choice attribute to your permission set schema.
Anything to watch out for?
The attributes used in some breakdowns can have more than one value for a user - the most common is permission sets, but you may have others. When breaking down by these attributes, the sum total for the attribute can be larger than the total transfers for the users because the same user action can (and should) be counted for each.
Location data
This product includes GeoLite2 data created by MaxMind, available from https://www.maxmind.com
