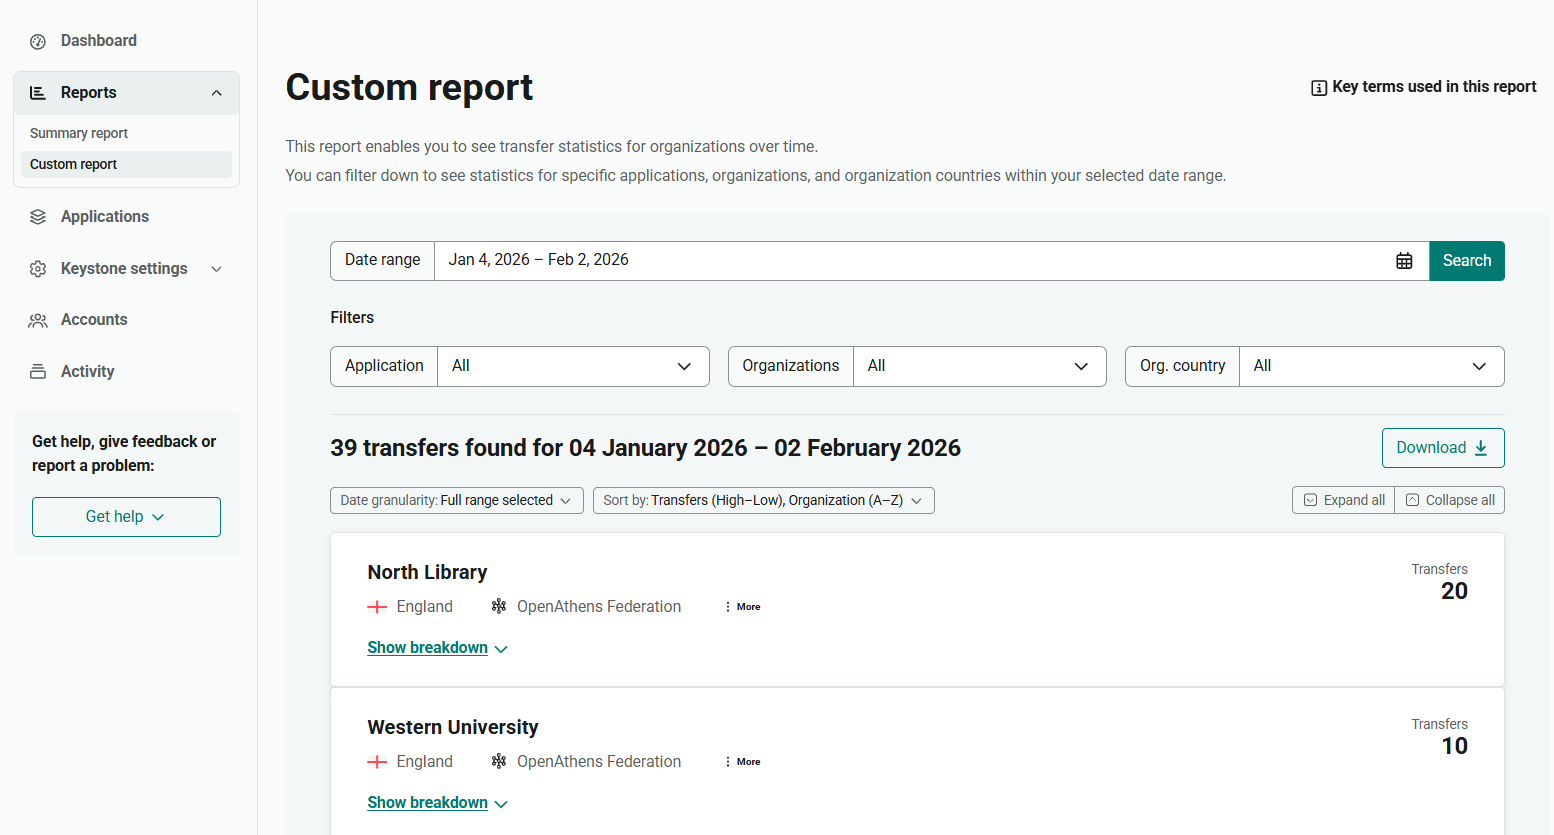
The custom report (Reports > Custom report) enables you to see a more bespoke view of your data. You can set a custom date range and filter by specific organizations, applications or countries. You also have options to sort or break down the data. Because the custom report does not have a preset date range, it does not include the same comparison data as the summary report.
Like the summary report, the custom report can be downloaded as a file.
Set date range
While the summary report has a preset choice of date ranges, the custom report allows you to select any date range from the period for which statistics are available.
The earliest date you can select is 1 August 2023, for OpenID Connect applications, or 1 January 2024 for SAML applications.
-
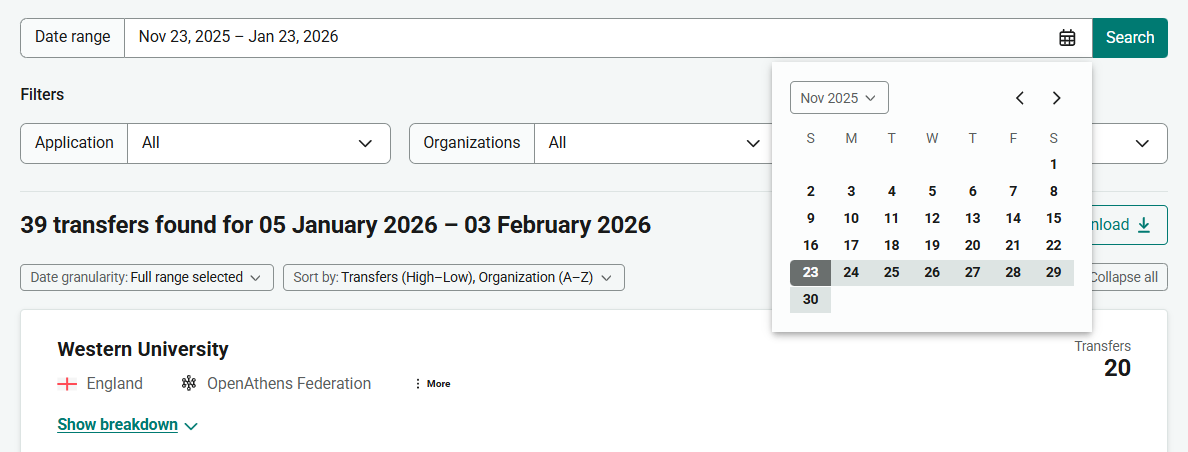
Click the Date range field. A pop-up calendar opens.
-
From the calendar, select the start date from which to view statistics. This date is loaded into the field.
-
From the calendar, select the end date from which to view statistics. This date is loaded into the field, forming a date range.
-
Press Search to refresh the report with your new date range.
Depending on the volume of traffic in your statistics, selecting a longer date range might cause the report to load slowly. Some reports may be too large to display in the browser, although you can still download them as a file.
Apply filters
You can filter the report by application, organization or country.
-
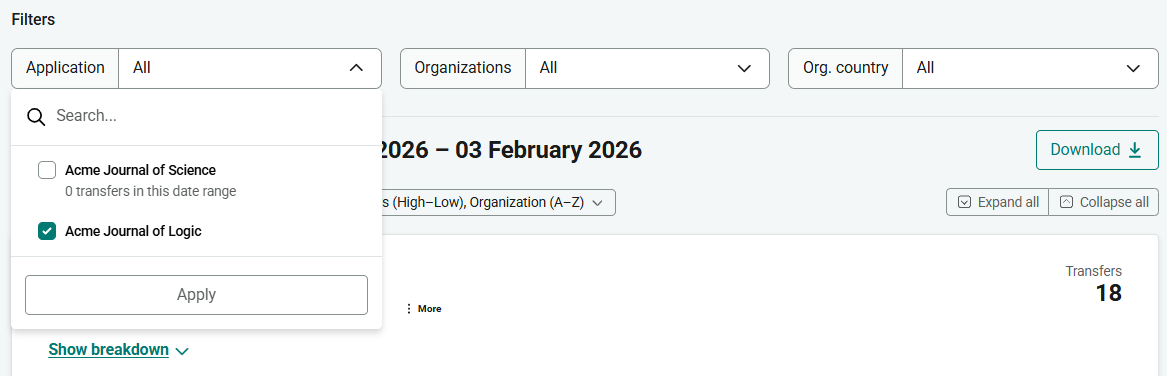
Open your chosen filter to see the available options. The Application filter, for example, shows your published applications. If any of the options had no traffic during the selected date range, a note informs you of this so you can avoid adding that item to your report.
-
Tick each item to include in the report.
-
Press Apply to update the report with your selections.
-
To apply multiple filters, repeat for each filter.
Run a report on a specific application
As well as selecting applications from the Application filter on this page, you can run a report on an individual application directly from the applications list.
-
Go to Applications.
-
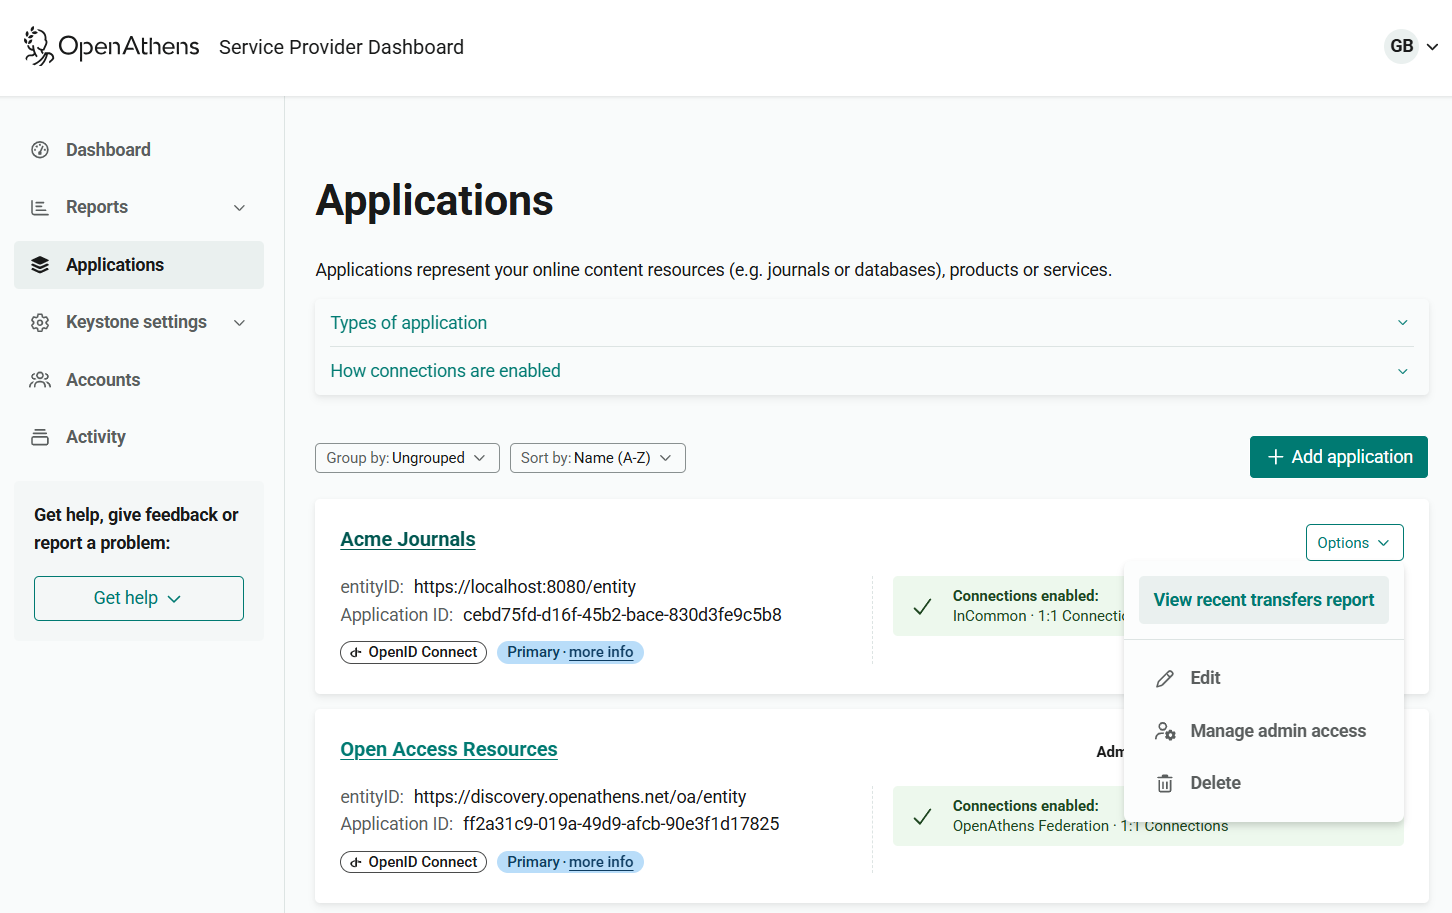
Open the Options menu beside the application you want.
-
From the menu, select View recent transfers report. You are automatically taken to the Custom report page, where you will see a report of transfers to the selected application within the last 30 days. You can configure this report using the date range and filter options as normal.
Set granularity of the report
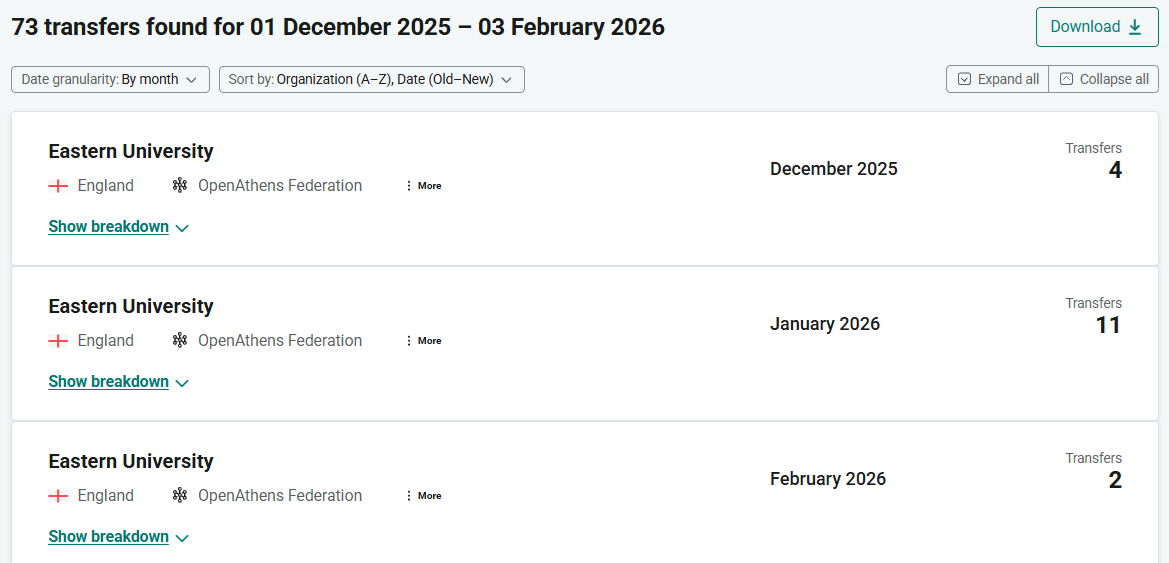
After setting the date range, by default you see the total numbers across that time period. You can break the report down by increments of time, in order to see numbers for individual months or days.
From Date granularity, select from the following options:
-
Full range selected. See the total numbers for all transfers from each organization across the date range.
-
By month. Break down the report by month. For example, if your date range spans December to February, you will see the number of transfers from each organization in December, in January and in February.
-
By day. Break down the report by day. For each organization in the report, you will see a list of the dates on which at least one transfer took place and the number of transfers that day.
Sort data
From the Sort by panel, choose how you want to sort the data. The sort options depend on the selected Date granularity:
-
Full range selected: sort by number of transfers and then by the name of the organization, or vice versa
-
By month: sort by the name of the organization and then by date, or vice versa
-
By day: sort by the name of the organization and then by date, or vice versa
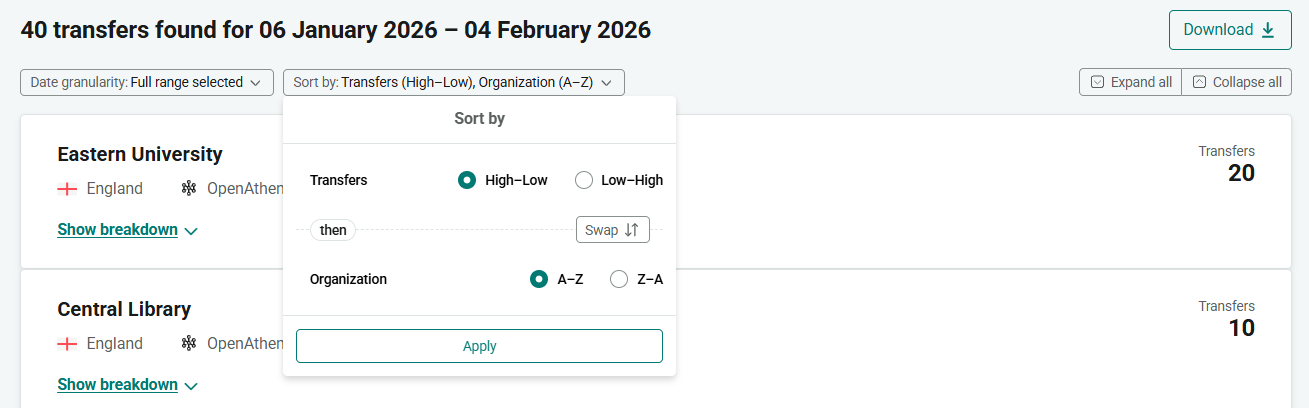
The sort order is reversible. If, for example, you want to find out which organizations generate the least traffic, you can sort by number of transfers with the lowest first.
View further detail
For each row in the report, click Show breakdown to see more information about the transfers that were logged.
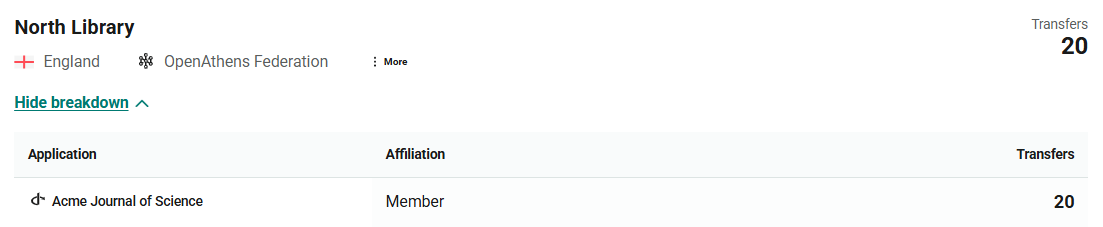
The breakdown shows the applications to which transfers were made, and the institutional affiliation (for example, member, staff or student) of the users who made them.
Click Hide breakdown to return to the previous view.
View all details
To expand the details of all rows, press Expand all at the top of the report. Press Collapse all to return to the default view.
Download report
To download your custom report, press the Download button. The download is a flat CSV file that you can load into a spreadsheet or other software.
Columns in the file include:
-
Parent organization. The top-level organization from which transfers came. For example, a university.
-
Organization. If relevant, a sub-organization beneath the parent organization, such as a specific department in a university. Sub-organizations are identified by scope. If a customer has no sub-organizations, the “organization” is effectively the same as the parent.
-
Org registration federation. The federation (or other means of authentication) to which the organization belongs.
-
Org country. The country in which the organization is based or is registered as an identity provider. Countries cannot be determined for 1:1 connections.
-
Org entity ID. The unique entity ID that identifies the organization.
-
Org scope. The scope (if any) that identifies a sub-organization.
-
Application name. The application to which the transfer was made.
-
Application type. Whether the application is an OpenID Connect application or a SAML application.
-
Application ID. Client ID of the application.
-
Application entity ID. Entity ID of the application.
-
Affiliation. Role of the user who made the transfer, such as Member or Student.
-
Transfer date: Date on which the activity took place.
-
Transfers: Number of transfers meeting the specified criteria.
If you are interested in using an API to download reporting data, let us know through the feedback form on this page or by writing to feedback@openathens.net.